I’ve seen on the forums that some people have been struggling with integrating the Atlas Scientific sensors onto the BlueROV system. There are a few different ways to do it, but here is what I did to integrate a conductivity sensor onto my BlueROV:
Starting off, in order to integrate an Atlas sensor onto the BlueROV, you must use a sensor that is paired with an EZO board. Atlas has thorough documentation on the EZO boards, providing important details about the board and sensor integration. Here is the one for the conductivity sensor EZO board that I used for reference. Pages 12, 14, 15, 16, 28, 31 were the most important for my process when integrating the Conductivity sensor on my ROV (more on that later). However it may vary between documents for the different sensors. This is the overall kit I got from Atlas. There are similar kits for pH, ORP, dissolved oxygen, and temperature. Learn more here. In the kit, it provides the necessary carrier board (where the EZO board mounts and the sensor plugs into before it reaches the RPI). The one provided in the kit has an SMA port and a pinout, which would work for UART, however I chose to use this one with a built-in USB micro port instead of the pinout to maximize durability and simplicity. Additionally, it’s ideal to purchase the SMA connectors/cables with the tinned leads separate from the Sensor cable so you can later splice it after potting the sensor cable in a penetrator.
Slip a penetrator over the sensor cable for later potting, then solder the sensor cable and SMA connector cable together (don’t forget heat shrink and O-ring!). Also, they recommend soaking the wires in alcohol before and after soldering them together to remove flux. Find more detailed instructions here.
Temporarily hook up the sensor to a desktop computer for calibration. In order to calibrate the sensor, you must download the AtlasDesktop software (you can find it under Documents and Downloads on the product page). They provide the step-by-step process in this video. As the sensor takes readings, the EZO board will flash cyan and green (see Pages 12 and 14 in EZO board document for LED color key).
After calibration, temporarily connect the sensor to the onboard RPI and pull up the BlueOS terminal. Enter the command “red-pill” to exit the docker container and get to root. Here you will need to install some libraries to run the USB mode for the sensor on the RPI. In this RPI code document, refer to page 6 and install the libftdi-dev package. You do not need to install the Python pylibftdi package. Go to the udev folder in the terminal and create a udev rule file. Open the file and create the udev rule as per the instructions. When you create the lengthy rule, do NOT enter - it is all one line of code. On page 7, only commence with the udev service restart - do not continue following through the rest of the steps on that page.
Next, you’ll need to install the Node-RED extension. Node-RED will be the dashboard for displaying the readings of the sensor. Tony at BR has provided a very helpful tutorial on setting up and utilizing Node-RED on BlueOS, here. He discusses the use of Node-RED Dashboard too, which will be key in displaying the sensor values (I utilized Node-RED Dashboard 2.0, but they’re both great). Create a serial input node, a function node, a gauge node (from either Dashboard 1.0 or 2.0), and a debug node. In the serial node, the baud rate should be at 9600, the input should be split on the character: 0x0D and deliver ASCII strings, the output messages should have the added character: 0x0D, and select the appropriate serial port (ie: “/dev/ttyUSBX” - X being whichever port number used). In the function node, write a snippet of JavaScript to exclude the “over voltage” (shown as *OV) alert from the returned message. Configure the gauge (or whatever you chose from the dashboard to display your readings) however you like. These nodes should all be connected into a single Node Flow (see figure 1 below).
Very important! In addition to the first Node Flow, you must create a second one as well using an “inject output string” node and a serial output node. In the inject node, inject a payload message to enable conductivity parameters and disable all other sensor parameters. Use page 28 in the EZO board document as reference for the commands. Inject each command one at a time. Deploy your Node Flows and the conductivity sensor readings should appear in the debug window.
To obtain the URL for the gauge dashboard, go to the upper right hand corner of Node-RED and click the little drop-down arrow. It will give you a list of options to choose from, including one that says “Dashboard” - click on that. It will take you to a new side panel menu showing all the nodes you have running on the Dashboard. Just under the drop down arrow is a button that says “Open Dashboard.” Click that button and it’ll open a separate browser page. In the URL, type “/page1” and the dashboard will finish loading (you can change this path name in the gauge node settings). Copy the URL of the gauge and paste it into an iFrame in Cockpit. Adjust the settings of the gauge browser view in the dashboard node as needed or as desired. Test the conductivity sensor in salty water and watch in Cockpit as the gauge fluctuates with the different readings.
This is a really helpful writeup, that I’m sure will be useful to others looking to integrate this sensor set - thanks for sharing!
It would likely be even easier if someone makes a dedicated BlueOS Extension (instead of everyone needing to manually install a library and create flows with NodeRED, but even without that it’s worth noting that Cockpit has recently added support for external widget detection, so if a relevant register_service endpoint is created alongside the dashboard then it may not even be necessary to copy the URL over to Cockpit )
I would love to have some help writing a BlueOS extension for our new ConeFET probe. It includes ISFET pH / ORP / EC / T all in a single i2C probe, and can mount with a WetLink Penetrator. Pretty cool…
Our extension development docs are reasonably comprehensive, and should hopefully provide a decent overview of what’s required and some pathways for achieving that
Beyond that, you’re welcome to open a new topic if there are specific aspects you’d like help with / that aren’t working how you’d expect, or you can have a chat on our development Discord if that’s preferable.
I have read through your post as I am currently investigating adding sensors to my ROV to assist marine researchers with their data collection. I am not an electronics or programming expert and have little experience in this field. Would you be willing to help me with integration?
The plan is to add the following sensors; Dissolved O2, PH and Temperature. I would like to if possible use an interlink board as this seems like the best option due to space in the electronics housing. It would be great to have a widget showing the readings on the main overlay so it can be recorded along with video and telemetry.
Geoffrey, I am also working to enable the Dissolved O2, PH, Temp and Salinity sensors via the I2C HAT. I have gotten three of the sensors to work on a stock RPi OS and am moving to the Blue OS now. I plan to get the standalone Python code working first, then swap to Red Node, and finally make a Blue OS Extension. Let me know if you’ve gotten any or all of this to work on your end. I’m happy to share what I’ve done as well.
Great to hear you are working with the sensors and the creation of teh extension. I have been away on a work contract so not had the opportunity to look at the integration further, I also lack the coding knowledge. Please keep me updated on your progress as I would love to fit these sensors this year and be able to view and record the data directly through Blue OS.
You can use an I2C to USB converter for this task but I’d recommend against it. First off, the Pi3 has I2C ports so you can talk to the i4 interlink directly, check out this document https://files.atlas-scientific.com/pi_sample_code.pdf to see how to set it up.
I also spoke to Atlas Scientific folks and they say you can access the sensors via the sample code with both USB and I2C. I got 3 of the sensors to work via I2C on a regular RPi OS install. I have now dug into setting up the USB support more. I found that I went too far trying to install the Python ftdi libs previously. I plan to use the USB connection only as a backup if I have some cable length problems.
I spoke to Blue Robotics folks previously and they told me that Navigator won’t pass through the GPIO pins needed for the InterLink board. I also found out that Cockpit will not display the video or telemetry w/o having a Navigator unit connected. BR also says it has not used a PixHawk (I have one from an old Blue ROV) that I could link in via USB as a development tool. So … I got a RPi GPIO extender connector that has pins for pass through to the Navigator and pins at a 90 degree angle for the InterLink board. I also have 2 of the Interlink boards that I can stack, so I have a total of 6 sensors. Pretty convinced I won’t run into I2C address conflicts, but I may run into a power supply issue; will hopefully see soon. Still on the fence as to whether I need to pick up another Navigator board.
Right now, I’m in wireless network Hell where the WiFi in my RPi with BlueOS won’t connect to my local subnet and then on out to the Internet. I want that to follow the instructions for using Node-RED to build the water sensor s/w, and to pick up the cellular modem Extension.
Hi @rsheffield99 -
It is possible to receive video in Cockpit without a Navigator, but without an autopilot additional telemetry won’t be present - beyond I2C pressure sensor if connected. I think you’ll have many more software struggles with I2C access for your sensors rather than via the recommended USB adapter, but that doesn’t mean it won’t be possible! Power is unlikely to be an issue…
Your WiFi access issue can likely be fixed by re-flashing BlueOS 1.4.2, or using another source of internet - your current IP may be blocked or firewall restricted in some way…
Noting that I2C support is possible if it’s handled through the autopilot (e.g. via drivers written as Lua scripts, or compiled into the firmware) rather than integrating it directly through BlueOS. Value updates could be sent via NAMED_VALUE_FLOAT (/_INT) MAVLink messages.
A BlueOS Extension and/or Cockpit DIY widget could still be used for nicer displays (using the autopilot’s reported values) if you want more than just a number / small dial per data type.
If you don’t want to integrate through the autopilot then making a BlueOS Extension as a driver is your best option, which provides more development flexibility but does not have direct access to most of the autopilot’s hardware (so cannot use the I2C bus).
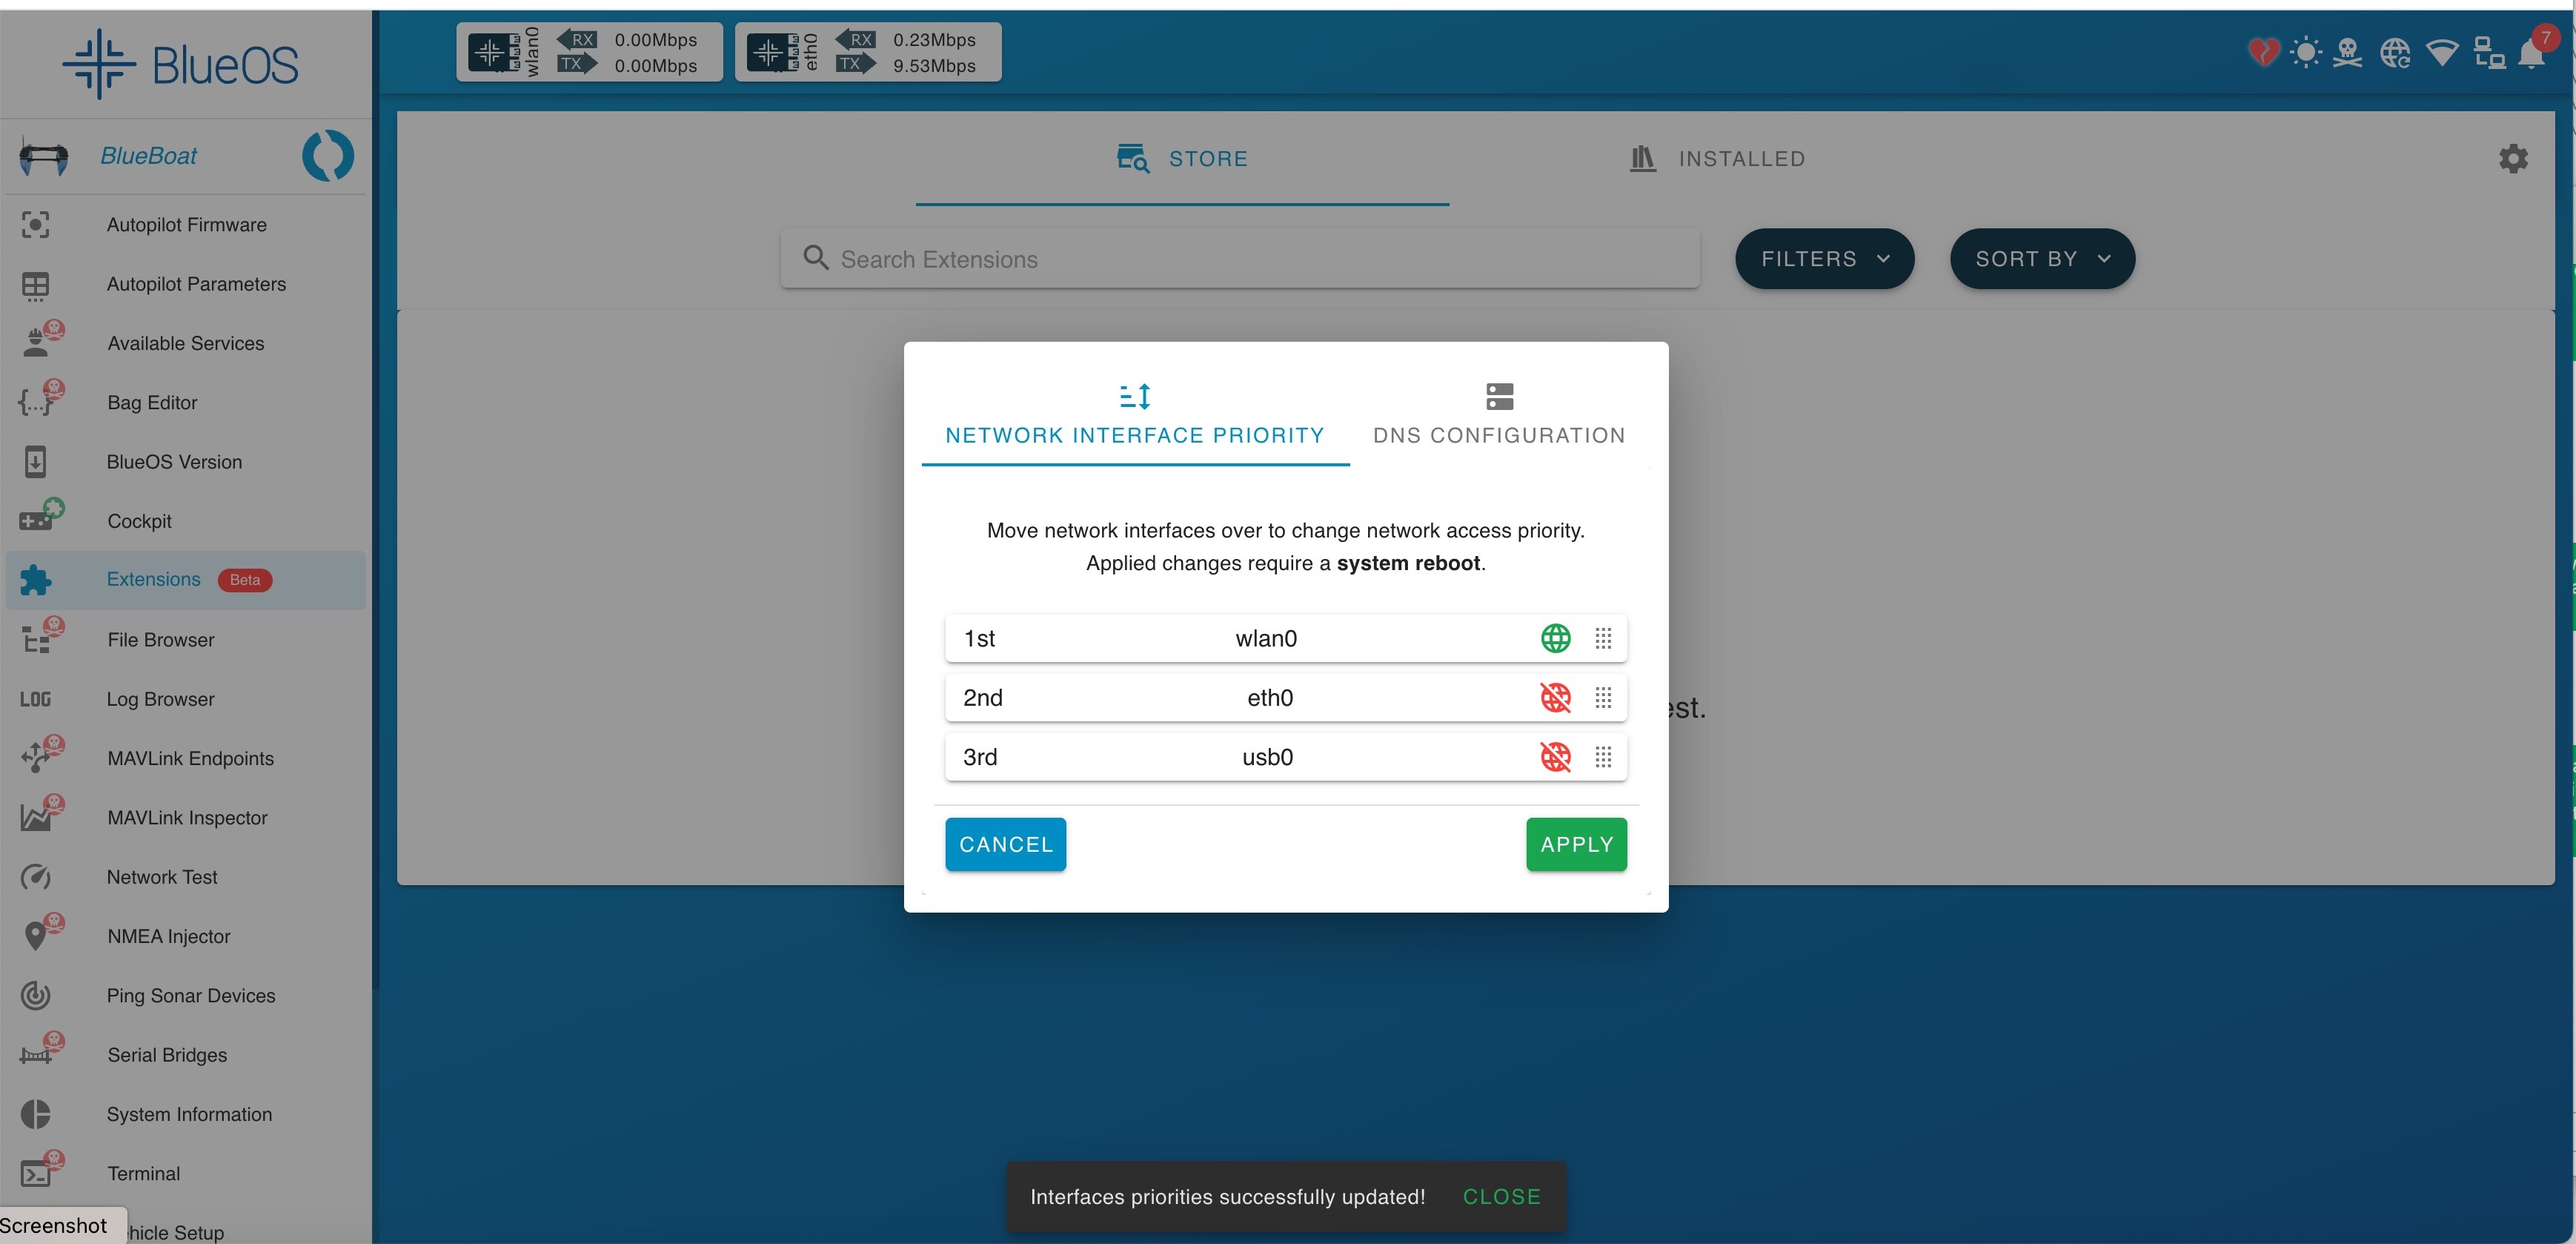
Tony, I will reflash the SD with BlueOS 1.4.2. That is the version shown in the interface screen, but I understand things can go wrong. I am a bit confused about the Internet connection though as the pop up shows a good Internet connection, but the globe widget in the header is still broken. Seems like there is a problem there. Also, note that I have another SD flashed with a normal RPi OS and have connected to the Internet with the RPi using that setup. Here’s the picture showing the Internet priority ordger again, just for reference.
Eliot, I do plan to make the Atlas Scientific water sensor s/w an Extension eventually. In the interim, I was looking for an easier path to take the Atlas sample application that already works with the RPi and use it to deliver the output values into Cockpit, where I can record the water sensor values along with GPS position in a video file. The assumption is that I can play those files back as in QGC to see the values change as I do transects over bodies of water, and that I can post process the data from the files independently if I want custom charts, graphs, etc.
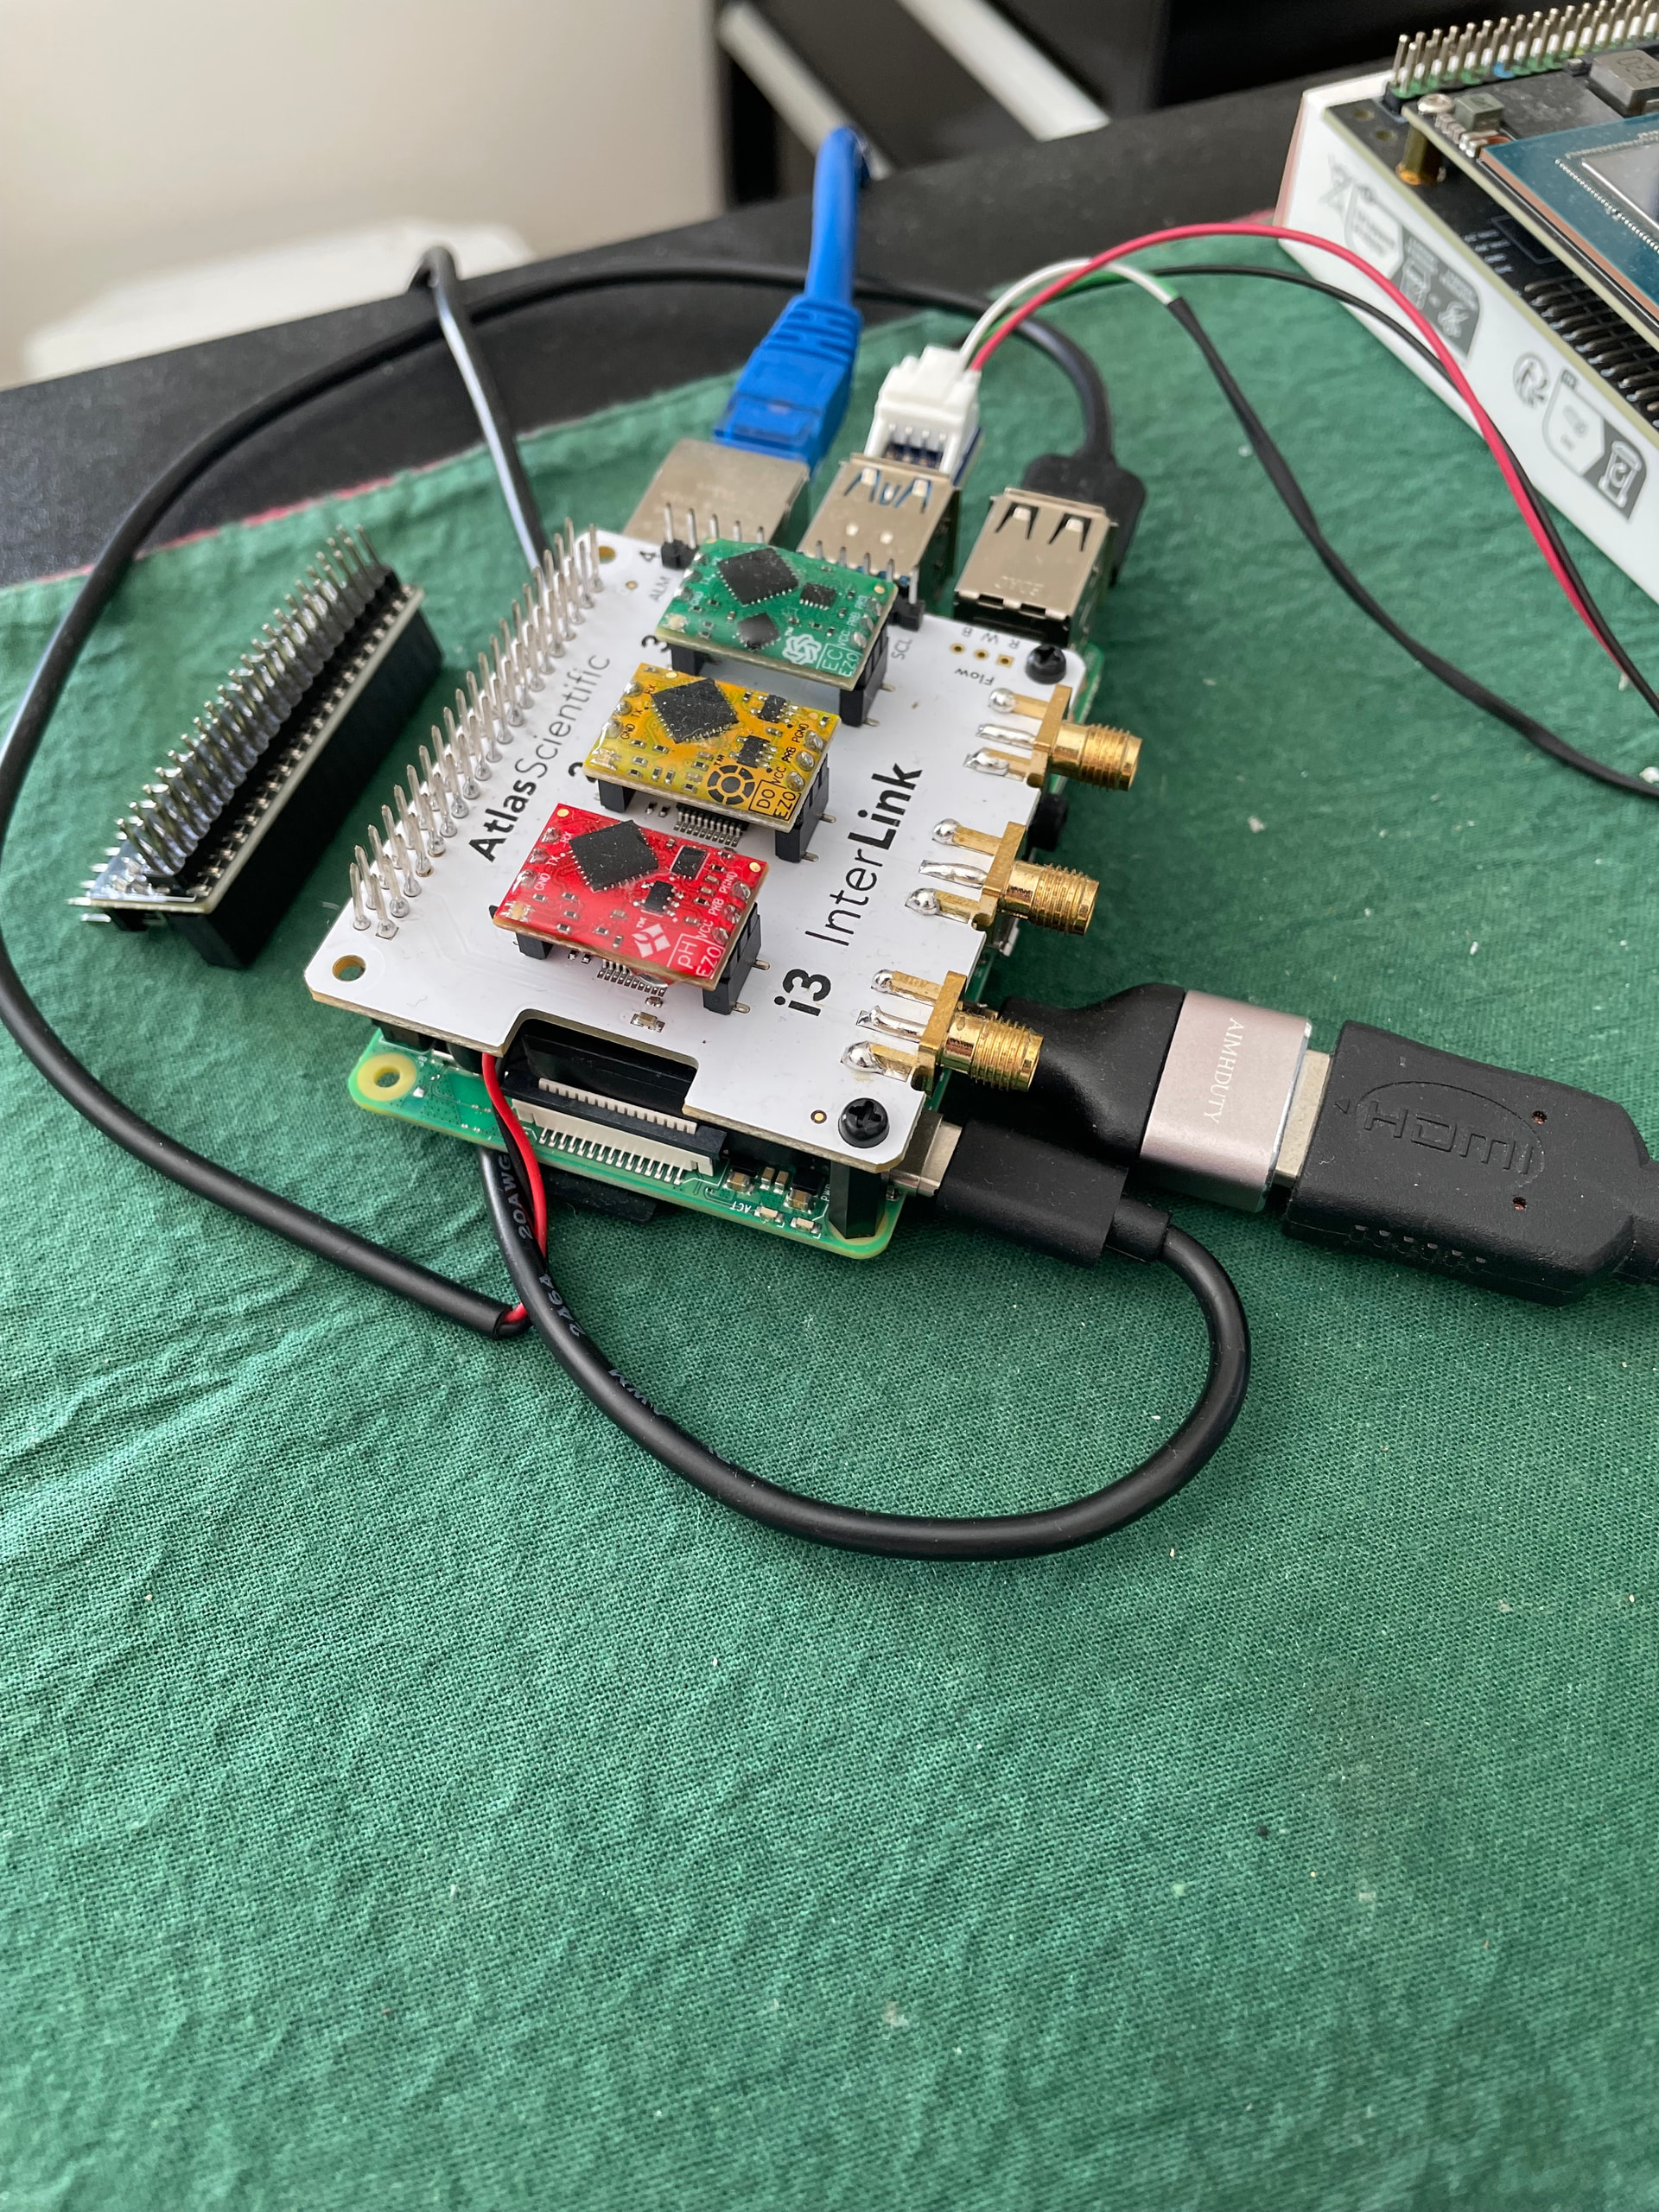
I am a bit confused about the I2C ports. This is a photo of my current setup with the RPi. I have successfully connected the Atlas Scientific sensors to the RPi (using a standard OS) and displayed the values of all sensors as text messages. My plan is to use the GPIO connector to the left to mount the Navigator board where the InterLink is now mounted, and mount the Interlink board(s) perpendicular to the RPi. This “should” provide the I2C signals to the InterLink board just as it does now, and drive the Navigator board in its normal configuration. What autopilot features do I need that would require I not use I2C in this manner? Don’t other autopilot devices, like the PixHawk communicate via USB to the RPi?
Tony, I reflashed the SD. I now have Internet connection via my local WiFi. Downloaded ZeroTier, Node-RED, and Cellular Modem Manager. I also have a preview window of the DWE camera output. I’m moving forward again, thanks.
If you’re trying to use I2C for your own purposes then you will likely have issues using it for autopilot peripherals, so you may have inconsistent readings from or failed connections to your depth sensor (and other connected sensors like a Celsius temperature sensor).
Indeed, independent flight controller boards (like Pixhawks) manage autopilot functionalities themselves, and can connect and communicate via USB (among other options).
The Navigator is reasonably unique in that it is just a peripheral board for the Raspberry Pi (with no computation capacity), so all the functionality goes via Raspberry Pi pins (which uses effectively all of them), and the autopilot code is run as part of the autopilot manager service in BlueOS (on the Raspberry Pi).
To use a pin for non-autopilot purposes (while running autopilot firmware with a Navigator) requires disabling the relevant functionality(/ies) in the autopilot (which is not always possible), and then configuring and using the pin via normal Raspberry Pi libraries. Otherwise there are conflicts, and one or both sets of functionalities can fail to work.
@Cnidaria_97 I have started to replicate your Node-RED graph. I missed installing the dashboard nodes; cleared up my first point. Second, you say write a Javascript for the function node to trap over voltage. Did you find a script that implemented that? It is mentioned that there are lots of scripts available in the community, but not how to search for the one you need. Still Googling how to search for canned scripts rather than creating them from scratch.
Hi @rsheffield99 -
You may find talking to a LLM AI, like Google Gemini or ChatGPT very helpful to generate that javascript! The more context you give it, including this forum thread, the better!
Tony, I’ve also looked at Python to Javascript generators, in case I might need to take the Atlas Scientific Python sample code and convert it to Javascript. If I just had the script from the Conductivity probe in this example, it would move me forward rapidly. Should be a simple screen shot from the function node edit.
I’ve not used the Atlas sensors with NodeRed before, but I imagine if you have them connected you’ll better be able to determine what the *OV message coming through as, and adjust accordingly to remove it. In any case, this LLM response, particularly option B, seems helpful!