I have mentioned this before I have not yet fully transitioned to using the Cockpit application; however, there are several aspects of it that I find promising, and I expect it to become a very useful tool at later stages. At present, I am still using QGroundControl (QGC), as it provides a simpler interface and has been reliable in my workflow.
There are a few usability and functionality points that could be improved. I am operating the system on a Panasonic Toughbook CF-31, which has a relatively small display. As a result, text and data presented in various widgets are rendered at a very small scale and are difficult to read during operation. The ability to scale or enlarge key telemetry and control data—such as pilot gain, lighting levels, camera tilt, voltage information, and similar parameters—would significantly improve readability and situational awareness.
Additionally, a built-in dive logging feature would add substantial value. Ideally, the application could automatically record dive-related metrics such as:
Dive duration (time the ROV is armed)
Maximum depth
Bottom time
Total cumulative dive time
This would allow operators to track ROV usage, operational depth history, and overall system runtime in a structured way, similar to a dive log used in human diving operations.
Hi @diveexplorer
I believe it’s possible to adjust your display scaling or the widget text size- @rafael.lehmkuhl may have feedback.
As for your log request, this functionality is already done regardless of QGC or Cockpit selection- checkout the autopilot logs page in BlueOS! The logs have the raw information, maybe you’re after a summary with the data points you listed automatically extracted? A quick chat with a large language model AI would yield a python script to extract that summary info from the log…
I’ve moved your comment to its own topic, as it didn’t seem relevant to a release post from over a year ago (and it seems unnecessary to notify everyone in that thread about responses to your feedback).
This does generally work with interface scaling, although there are some limits in place. What happens when you press CTRL + (i.e. CTRL+SHIFT+=) and CTRL -, or use the View / Zoom In and View / Zoom Out menu bar options?
If those don’t work well for you then please let us know, so we can try doing some dedicated testing with a simulated 1024 x 768 display size to see if we can replicate (and hopefully fix) your problem.
The autopilot also records high-frequency DataFlash logs of its internals, sensors, and communication, which can be accessed through the BlueOS Log Browser.
Maintenance and mission-related statistics would definitely be useful, but don’t seem (to me) to be within the domain of a real-time control station software like Cockpit. I think they should be calculated and stored on the vehicle (so they can be control-station agnostic), and potentially synchronised to a higher level vehicle manager/tracker[1] to facilitate fleet management, or just reasoning about a vehicle or mission while the relevant vehicle is offline.
I do think Cockpit should allow inputs to such a system[2], and be able to make use of information from it, but I believe the underlying data should not live in Cockpit, if that makes sense.
I am curious how you would want this tracked, and what you expect it would be useful for.
If the vehicle follows a progressively deeper sea floor, is it at the bottom the whole time, or is bottom time just the time spent at (or near) the maximum depth? And what happens for separate dives - is bottom time only time spent at the globally maximum depth, or could you have 20 minutes at 30 m depth from one dive, and add on 45 minutes at 100 m depth from another dive?
I guess the core question is whether you’re interested in time spent near the “floor” (e.g. as a thruster maintenance consideration for time in extra silty conditions), or time spent at a given depth (e.g. to evaluate seal/crushing performance). The former would likely require a downward facing sonar (or accurate bathymetric maps, but they’re often hard to find). The latter would be straightforward to determine from the depth sensor values, and could maybe be tracked in some kind of histogram with progressive/exponential bin sizes or something?
For what it’s worth, Blue Robotics is currently working on an (optional) cloud service for people and organisations to manage their vehicles and mission data (including logs, video recordings, and operating statistics), which I am hopeful will end up as very valuable for maintenance tracking and the like. ↩︎
A major upcoming improvement in BlueOS 1.5 is to synchronise basically all the information passing through BlueOS (including the video stream, telemetry, service logs, etc), which will likely make adding an event-recording system to Cockpit a fair amount easier. ↩︎
It is really useful to have the overall usage of the sub, as to how long he has been operating. And dive time is part of that. Of course, there can be, where you are turning the sub on without it getting wet. However, it could then be noted in the logbook. You don’t need the metadata in that information. Like all divers, flight pilots, and even drones have logbooks. Where the most useful and important information is logged.
Here you can see DJI drone “logbook” in their app.
With that information, you know fairly easily how much the “drone” has been used. Of course, this is not perfect, but having software to log it for you is, as I said, really helpful.
This is overthinking things.
When I scuba dive and log a dive, I don’t necessarily record how long I stayed at the maximum depth. I log the total dive time, which is the time from when I go underwater until I return to the surface. That is my “bottom time.”
Even if I stayed only one minute at 45 meters, the entire dive might have been 35 minutes, including decompression. That is what I record in my logbook. (35 min dive - 45m depth / than you could also take average depth) I also log the date, location, temperature, sea state, and any other information I choose to include.
Logging dives this way can tell me—and others—a lot of things: experience level, number of dives, deepest dives, locations, and more.
It’s like the odometer in a car: you want to know how many kilometers it has been driven.
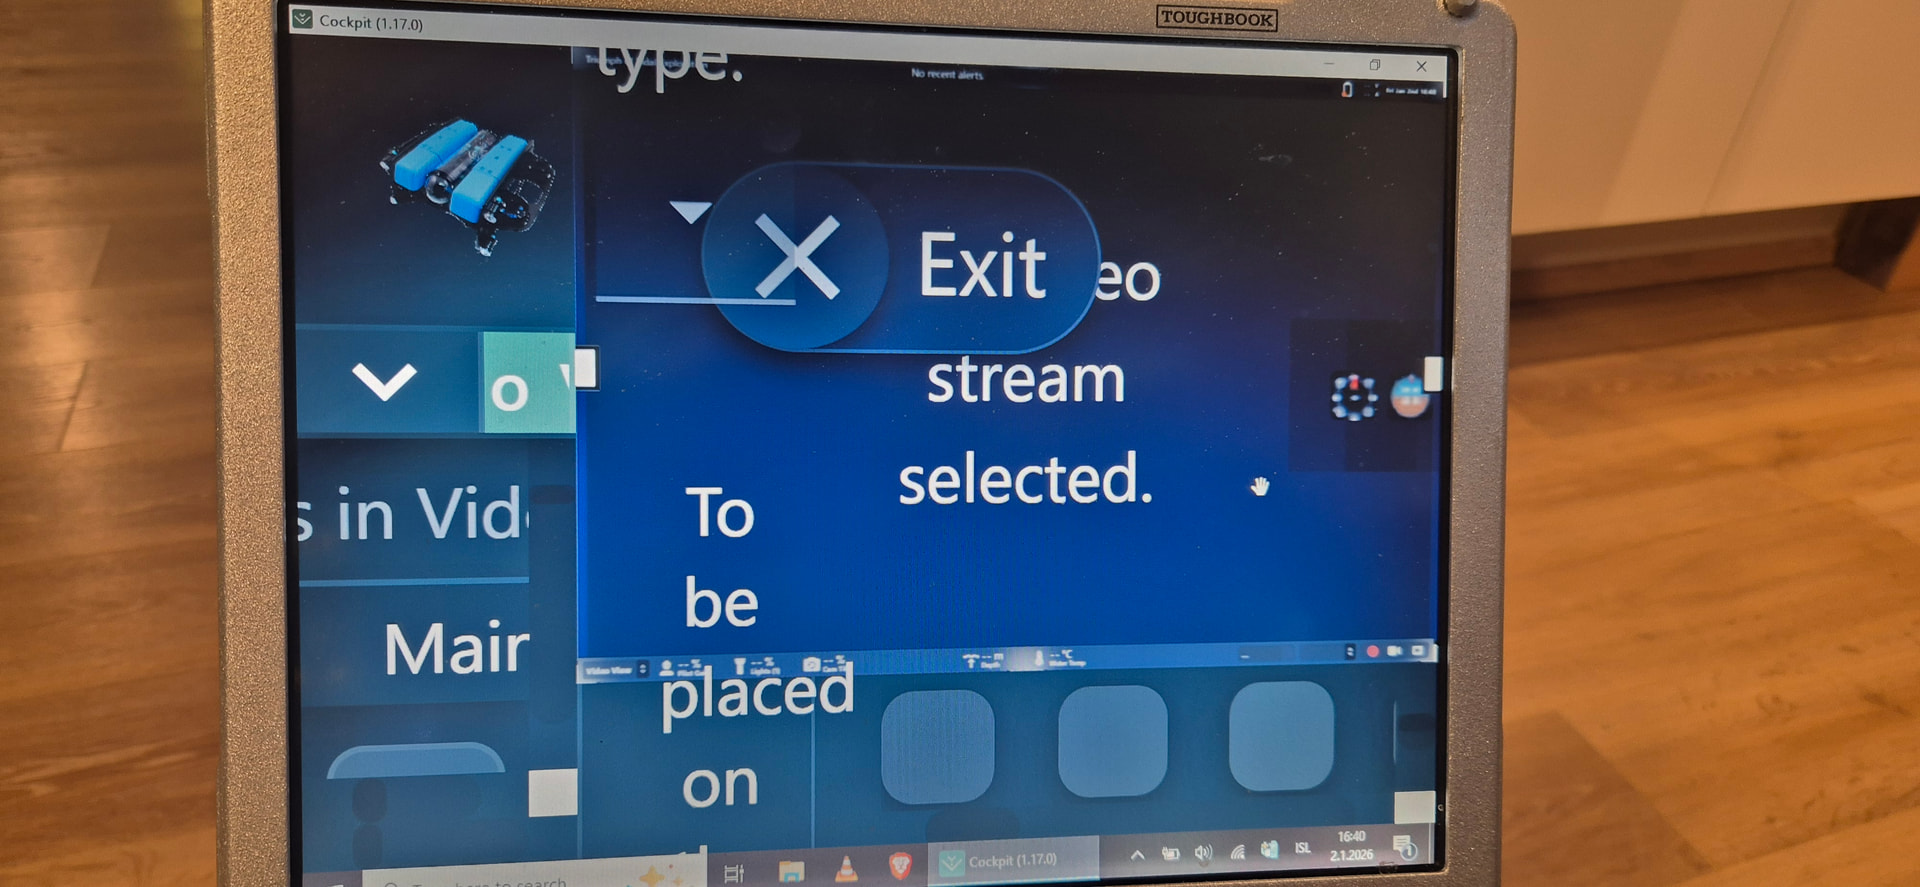
I have been trying this out on my old CF-30. My newer CF-31 at work is, very similar computer, but with an I7 CPU. But the screens I think same. Neither is the best for viewing, but they are robust.
I have not managed to get it better. Those pictures maybe can show he results
Fair enough - that sounds similar to things we’re already working on. As mentioned though, I think this makes more sense to track in the vehicle (e.g. in BlueOS) than in the control station software (since it’s not guaranteed the same computer or software is consistently used to control a vehicle).
I see - so you’re after dive time / armed time rather than time at a given depth. That’s definitely something we’re looking at tracking already
Yep - those basic stats make a lot of sense to keep track of for a vehicle, and also for a given “mission” for commercial users
In terms of maintenance/usage tracking I do think the histogram approach I suggested could be an improvement over raw (and independent) values for dive time and maximum depth, but advanced insights aren’t critical before the basic metrics are readily available
Yep - looks like you’re running into the limits I mentioned.
It’s counter-intuitive, but could you try zooming out until the size starts changing? I did a quick test and found there’s a zoom level above which the bar height gets fixed, and before that it’s dynamic (and ends up potentially bigger than the fixed size).
In the meantime we’ll try to look into improving the sizing rules, although I’m unsure how complicated this will be to fix well - consistent and reasonable sizing of dynamic elements is a surprisingly difficult part of interface management